CPUlator is a simulator and debugger of a computer system (CPU, memory, and I/O devices) that runs inside a web browser. Simulation allows running and debugging programs without needing to use a hardware board. When you load a program onto the simulator, the program will behave (almost) identically to the same program running on real hardware. The simulated systems are based on the computer systems from the Altera University Program (Nios II, ARMv7, and RISC-V) or SPIM (MIPS).
A simulator has several advantages over hardware. It is more convenient and easily accessible than a hardware board. Also, compared to hardware, a simulator has greater visibility into the system state and can warn about suspicious behaviours, such as self-modifying code or violating calling conventions, making debugging easier.
The following is a feature comparison of CPUlator with some popular simulators used for teaching.
| CPUlator | MARS 4.5 | RARS 1.6 | QtSPIM 9.1.20 | ARMSim# 2.1 | |
|---|---|---|---|---|---|
| No download/install | |||||
| Platform | Web browser | Java JRE | Java JRE | Windows, OSX, Linux | .NET 3.0 |
| Free | |||||
| Open-source | |||||
| Editor | |||||
| Code completion | n/a | n/a | |||
| Assembler | GNU | custom | custom | custom | GNU |
| C or other languages | |||||
| Debugger | |||||
| Breakpoints | |||||
| Single-step | |||||
| Reverse step | |||||
| Step over function | |||||
| Step out of function | |||||
| Modify registers | (except pc/ra) | ||||
| Modify memory | |||||
| Show call stack | |||||
| Runtime calling convention checks | |||||
| Data watchpoints | |||||
| Instruction sets | MIPS32 r5 MIPS32 r6 ARMv7 Nios II RV32IMAFD+ | MIPS32 | RV32/64 IMFDN | MIPS32 | ARMv5 |
| Self-modifying code | Partial | ||||
| MMU | |||||
| FPU | |||||
| Memory model | 4 GB flat | 5 segments | 5 segments | 5 segments | 1 segment |
| Maximum usable memory | 2048 MB | 4+4+4 MB data 4+4 MB code | 4+4+4 MB data 4+4 MB code | 4+1+0.5 MB data 256+64 KB code | 96 KB data 512 MB code |
| I/O devices | |||||
| Terminal | |||||
| File I/O | |||||
| Other devices | |||||
| Simulation speed (Minst/second) | 20 | 12 | 0.8 | 10 | 1.8 |
If you want to simulate a compiled executable instead of assembly source code, see the Compiling Code section below.
The CPUlator user interface is similar to a typical debugger. If you're already familiar with other debuggers, it should be possible to use CPUlator without reading the rest of this documentation. There are a few things to keep in mind:
CPUlator is a client-side WebAssembly running in a web browser. Any web browser new enough to support WebAssembly should work.
Mobile touch-screen devices are strongly discouraged because the user interface is designed to use a mouse (for resizing and moving the panels).
CPUlator is a functional simulator of a computer system (CPU and I/O devices), a debugger, and (an interface to) an assembler
There are four main components in a typical development flow for simple assembly programs: Source code written by the user, an assembler (or compiler for a higher-level language) to transform the source code into executable machine code, a computer system to run the machine code, and a debugger to observe the behaviour of the program running on the computer. CPUlator provides the assembler, computer, and debugger inside a web browser.
CPUlator's design was based on the Altera Monitor Program, so there are many similarities. In the Altera Monitor Program development flow, the Monitor Program provides the assembler and debugger, while the computer system is running on an FPGA development board attached to the host PC over a programming cable. (Top-most option in the figure below)
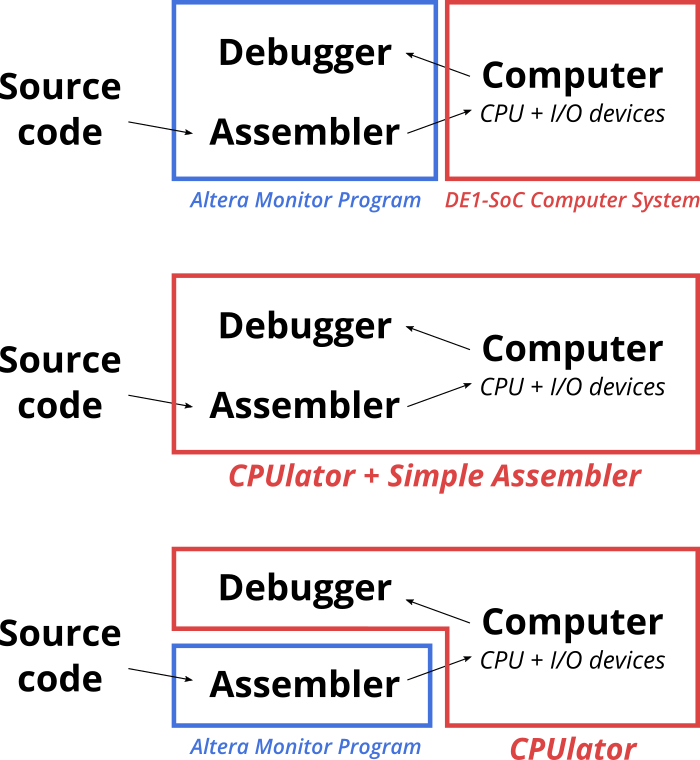
CPUlator replaces both the computer system and debugger, and optionally also the assembler. For simple programs (one source file), using the built-in editor and assembler (GNU assembler) is the most convenient option (Above figure, middle option). For more complex programs, it is also possible to assemble or compile your project into an ELF executable using any tools you wish (e.g., Altera Monitor Program) and then simulate the executable (above figure, bottom-most option).
Internally, the CPUlator simulator simulates executable machine code (it does not directly simulate assembly source code). You can compile your source code using the built-in assembler, Altera Monitor Program, or any other development tools you wish. The built-in editor and assembler is limited to working with a single assembly-language source file. If your program requires more than one file or is written in another language (e.g, C), you must compile the program yourself and simulate the compiled executable.
The built-in assembler is an interface to the GNU assembler. When Compile and Load is clicked, the contents of the Editor is uploaded to the server, saved as a single file, then run through the GNU assembler. The server then sends back the ELF executable and any assembler output messages, and the executable is loaded into the simulator.
Because the ELF file is generated at the server, there are limits on the size of the compiled executable (currently 12 MB). If your program is bigger than a megabyte or so (which sometimes happens if it includes images or audio as initialized data), it is usually faster to compile your program locally than to download megabytes at every compile. If your program is substantially bigger than this, be aware that the executable size causes the simulator itself to consume memory to hold the executable. Don't expect the simulator to work with gigabyte-sized executables.
ARMv7 only: The GNU assembler uses "divided" syntax by default. If you're writing in the newer "unified" syntax, use a .syntax unified directive to change the syntax. The differences are minor, so this won't affect most programs. The CPUlator disassembler uses instruction names in unified syntax.
The Altera Monitor Program can be used to compile projects without being connected to an FPGA board, as long as actions that interact with the board are avoided.
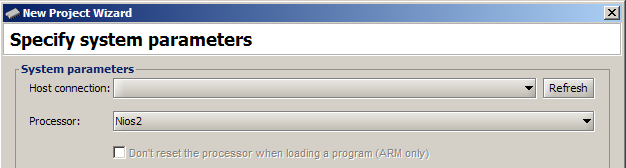
When creating a project, specify the "DE1-SoC Computer" system (or the system you'll be simulating) as usual. This is important because the compiler makes certain assumptions (e.g., system memory size) that depend on the computer system, and should match what's being simulated.
When prompted to select the programming cable, leave it blank, as we
won't be using it.
When prompted, do not download the computer system to the board. 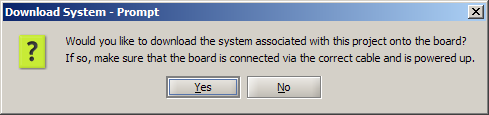
You can now "Compile" your project, but do not use "Load" nor "Compile & Load".
Compiling the program produces a filename.elf (or filename.axf for ARM) executable file in your project directory. To load the executable
into the CPUlator simulator, use File → Load ELF Executable and choose this executable file.
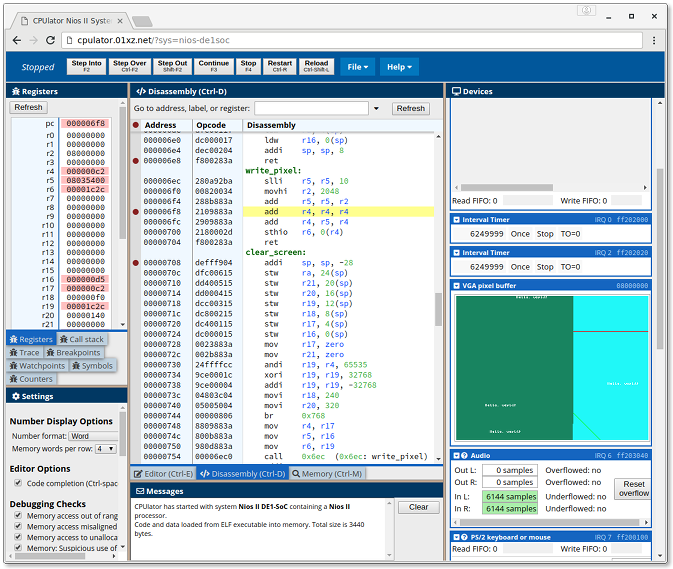
The simulator interface consists of the Toolbar and a collection of movable panels. The panels can be moved, resized, undocked as a movable window, and docked to any part of the browser window, by dragging the title bar (or tab, if docked). The default arrangement is organized by function:
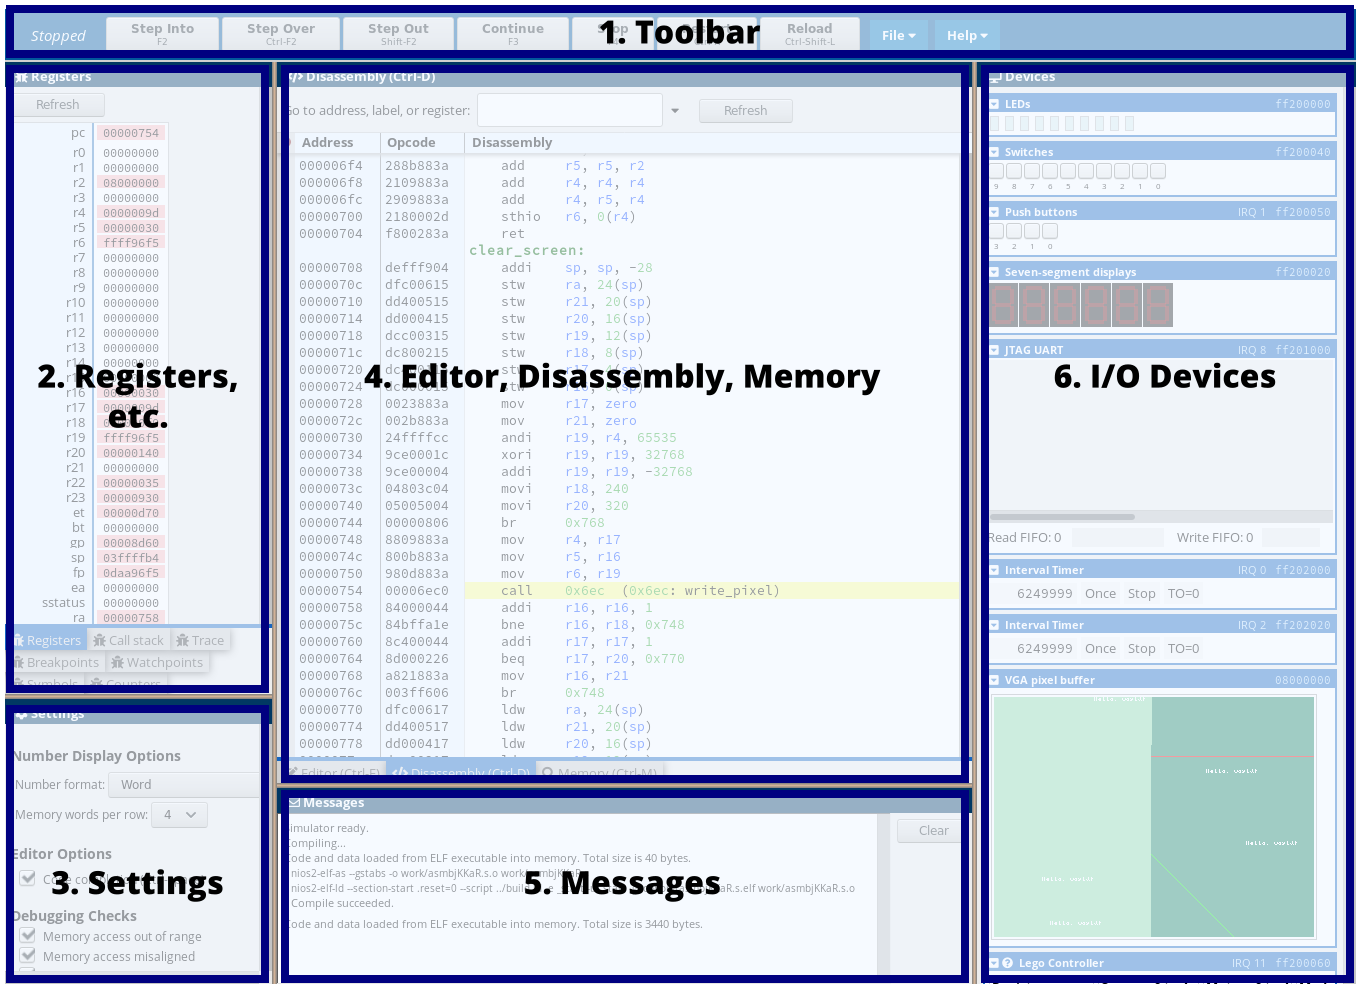
The toolbar along the top has the usual debugging operations: step, step over, step out, continue, stop, restart, and reload. Most of these functions are mapped to the same shortcut keys as in the Altera Monitor Program. There are also two drop-down menus: File and Help.
Step into single-steps the execution of one instruction. Step over differs from step into when single-stepping a call instruction. Step into will single-step into
the first instruction of the function, while Step over will skip over the function entirely, stopping at the instruction following the call.
This can be useful for skipping over big assumed-bug-free functions such as printf. Step out runs the program until the current
function returns to its caller.
Step over and step out are implemented by tracking function calls and returns (the same mechanism used to show the call stack). If your function calls and returns are not properly paired or you use an unusual call or return method that is not recognized as a call or return, you may get strange behaviour.
The Reload function reloads the previously-loaded executable into memory. If you loaded an ELF executable from disk, it does not reload the program from disk. You will need to select and load the ELF file again. (Web browsers generally do not allow JavaScript programs to read a file from disk without user interaction, including a file that has changed since the user last selected it, for security reasons.)
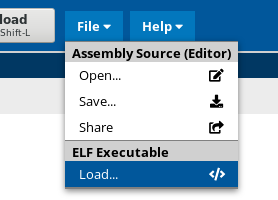
The File menu includes operations to load and save files to disk.
Open Assembly Source loads a file into the Editor window. Alternatively, copy-pasting code into the Editor window is equivalent.
Save Assembly Source downloads a file containing the contents of the Editor window. Alternatively, copy-pasting the Editor window to save your code elsewhere is equivalent.
Share Assembly Source uploads the contents of the Editor window and creates a link to it. Anyone with the link can see the uploaded code. The new link opens in a new window.
Load ELF Executable loads a compiled ELF executable into the simulator. You can then run and debug the program using the Disassembly and Memory windows. The Editor window will be unused when simulating an executable.
The Help menu contains a link to documentation (this page), and some sample programs.
Sample programs come in two forms: ELF executable without source code (), and assembly source code (), which can be distinguished by the icon. Most of the sample programs test various I/O devices, so they will only behave as expected when running on a system that contains the I/O device.
The Editor window provides an interface to conveniently write simple (single-file) assembly language programs. Clicking Compile and Load (or pressing F5) will compile the code in the Editor and load it into the simulator. See the section on Compiling Code for more details or if you need to simulate a more complex program.
Code completion is activated by pressing Ctrl-Space in the editor. This pops up a list of instructions. Code completion only suggests instructions, but not the operands, so the instruction list only pops up while typing the first word of a line. The list of instructions is not exhaustive. It omits some variations of the instructions (e.g., it only contains the basic form and omits the 15 conditional variations of each ARM instruction). The list may also include instructions that the simulator does not support (some uncommonly-used ARM instructions).
The disassembly window shows the disassembly of the machine code (bytes) in a memory region. The disassembly is an interpretation of the machine code in memory, and can differ from the source code, especially if the machine code in memory has been modified (self-modifying code).
The disassembly window optionally shows source code lines that generated the machine code, interleaved in the same window, in a lighter gray colour. How much source code is shown depends both on the Show source code setting and whether your program includes debugging information. For programs compiled using the built-in assembler, debugging information is included and full source code can be displayed. When simulating ELF executables, the simulator does not have access to the source code that generated the executable, so it can only display the source code file name and line number that corresponds to each machine instruction. The CPUlator debugger uses debugging information in DWARF format embedded in the ELF executable. Usually, compiling with a -g flag will generate debugging information in DWARF format, as DWARF is usually the default (Or use --gdwarf2 to explicitly specify DWARF version 2 format).
Immediately above the disassembly window, there is a "Go to address, label, or register"
text input. This allows you to jump to a particular location in your program.
The box will accept hexadecimal numbers (3a8), labels (_start), or
registers (pc).
You can force the program to move to a different instruction by changing pc.
This can be done by changing pc in the registers window, or
double-clicking the target line in the disassembly (This works the same way in the Monitor Program).
The memory window shows a region of memory as an array of 32-bit words. The number format and number of words per row is configurable in the Settings window. You may edit values in memory by clicking in the window to pop up a text box, entering a new value, then pressing Enter. Pressing ESC will cancel the edit. Above the Memory Window, the "Go to..." box works in the same way as for the Disassembly window.
The memory contents in each row interpreted as ASCII characters are also shown (to make text strings easier to read). Unprintable characters are shown as a dot (•), and null bytes (those with value 0) are shown as a black dot.
When viewing the memory address ranges of memory-mapped I/O devices, the simulator will show you the values at those memory locations as if a load were performed, but without triggering any of the side effects that would normally be performed in response to a load (such as dequeueing a FIFO). This makes it easier to observe the system state without disturbing it. This behaviour differs from using a debugger with real hardware, where side effects can occur. (However, there is currently no method to intentionally trigger the side effects from the debugger.)
Memory contents can be loaded from or saved to a file. Raw and text file formats are supported. This can be used to import or export memory contents to a spreadsheet or other program for post-processing or viewing. The file load and save options can be accessed by clicking on the button near the upper-right corner of the Memory window to show the sidebar.
The text file formats encode the memory contents as a series of numbers, each separated by a delimiter. The delimeters supported are LF (UNIX-style line break), CR+LF (Windows-style line break), and comma (all numbers on one line, separated by commas). The Element size setting specifies the number of memory bytes that form each number, which is useful for arrays of integers or floating-point numbers that exceed one byte each. If the size of the memory region is not a multiple of the element size, the memory region is shortened to a multiple of the element size. Each number can be formatted using octal, decimal (signed or unsigned), or hexadecimal base.
The raw file format just contains each memory byte in the memory region, unmodified. The Radix and Element size settings are not used for raw files.
For an example of the file formats, save a region of memory to file and look at the output.
When loading memory contents from a file, you need to specify the starting address at which the file contents are written. The contents of the input file determine the number of bytes written to memory. The maximum input file size is limited to 256 MB. When loading from a text file, the delimiter setting is ignored. Both whitespace (including newlines) and commas are accepted as delimiters between numbers. After entering the start address, click Load from file to choose the input file.
When saving memory contents to a file, you need to specify the memory region to save. The memory region is specified by entering the start address (inclusive) and either the end address (exclusive) or length. The start address and the end address or length (whichever is more recently focused) are used to calculate the third field (shown in gray). The size of the memory region to be saved is limited to 96 MB (which could create a text file up to 576 MB). Once the memory region has been entered, click Save to file, which generates the output file and saves it. Whether it shows a dialog box to choose the output filename depends on your browser settings ("Ask where to save each file before downloading").
This shows the current values of the CPU registers. Registers that have changed since the last time the simulator was paused are highlighted in red. You can change the value of a register by clicking on the register value, entering a new number, and pressing Enter.
The trace and call stack show what the program has been executing. The trace shows the last 200 instructions that were executed. The call stack shows the current stack of function calls since the last processor restart. Click on the instruction in the list to highlight and scroll to the instruction in the disassembly window.
This lists all of the breakpoints that have been set. Set or remove breakpoints by clicking in the left-most gray column in the disassembly window, next to the instruction where you want the breakpoint. You can also remove all breakpoints using the Clear button in the Breakpoints panel.
The list in the breakpoint window allows you to make breakpoints conditional. A conditional breakpoint stops the program only if the specified condition evaluates to true (non-zero). For example, a condition of r3==0 would cause the breakpoint to trigger only if register r3 is zero when this instruction is reached. A blank condition is treated as the condition "true" (an unconditional breakpoint).
A watchpoint is used to pause the simulation (like a breakpoint) whenever a certain region in memory is read or written. There are four data watchpoints to allow monitoring four memory regions for loads and stores (but not instruction fetches).
Each memory region has a start and end address (in hexadecimal). The R and W checkboxes select whether the simulation should stop when a memory read or write occurs. Regardless of whether these checkboxes are enabled, the number of reads and writes into the memory region and the most recent instruction that accessed the region are recorded. The Reset button resets these counters.
This table lists all of the symbols (labels) found in the most recent loaded program. The symbol name and value (address) are listed. For convenience, you can jump to the address in the Disassembly or Memory windows by clicking on one of the two icons next to each address.
This shows some performance counters, which are reset when the simulation is restarted.
The devices window allows you to interact with the hardware devices in the computer system outside the CPU, such as LEDs and switches. Because we're limited to operating in a web browser, the interface sometimes differs from a hardware board. For more complicated I/O devices, the simulated device may have limited functionality. In some cases, the interface also shows extra debugging information about the state of the I/O device, to help in debugging your program.
The panels in the Devices window can be reordered by dragged them, so you can group commonly-used devices together for convenience. For even more flexibility, the panels can also be "floated" out of the Devices window and become its own window that can be moved and docked. Use the Show in a separate box option in the device's drop-down menu to cause the device panel to float. Selecting the option again will unfloat the device panel (move the device's panel back into the Devices window).
Once a panel is floated into its own box, it can be "rolled up" to save screen space. A rolled-up box shows only its title bar and not its contents. Click on the title bar icon (upper left corner) to roll up or roll down a floating box.
This changes how numbers are displayed in various places in the simulator. For the ASCII byte option, bytes are show as a single ASCII character if it is printable, or as two hexadecimal digit if not.
There is currently one setting here: To enable or disable code completion in the Editor.
The Show source code option controls how much source code should be shown in the disassembly window. There are three options:
The checkboxes control whether each assertion should be enforced. Turning off some of these may be useful if your program does something unusual and the assertion is too stringent. Hover over each checkbox for a description of each assertion.
Changing the system affects which CPU and I/O devices are in the system. Changing the system requires a reload of the simulator. See the Simulated Systems section for a description of the systems.
The simulator's memory usage grows with the amount of simulated memory that is written to by the simulated program. A program that writes to memory in a loop can hit the 2 GB WebAssembly heap limit fairly quickly, at which point the simulator stops working. The Memory usage warning setting stops the simulation when the simulator allocates memory in excess of the warning threshold, to prevent a program from inadvertently using a large amount of memory. Currently, changing this threshold requires reloading the simulator. If your simulated program uses a large amount of memory, you may need to reload the simulator with a higher warning threshold.
(The memory use tracked here is the size of the WebAssembly heap, used by the portion of the simulator that uses WebAssembly.)
The messages window at the bottom shows messages generated by the assembler, simulator, and debug assertions. The clear button clears the window.
The CPUlator simulator does more sanity checks than a real processor, to catch common errors. When it detects something suspicious, the simulator will stop executing (as if a breakpoint occurred), allowing you to examine the cause of the problem as soon as it's detected (instead of later when an incorrect result or unexpected behaviour becomes visible). Any of these checks can be disabled by unchecking the desired checkbox in Settings → Debugging Checks.
A computer system contains a processor and I/O devices. This section discusses the simulated processors and systems separately. A processor can be used in many different computer systems that differ in the set of I/O devices.
There are currently five supported processor instruction set architectures:
Nios II: Models a Nios II/f without MMU. All instructions are supported, including FPH1 floating-point (fmuls, fadds, fsubs, fdivs), and internal interrupt controller. Some exception conditions aren't implemented (e.g., divide by zero exception), and some are implemented differently from hardware (e.g., break stops the simulator instead of taking a breakpoint-type software exception).
ARMv7: Models a Cortex-A9. Includes integer and floating-point instructions (VFPv3) and GIC interrupt controller. Excludes MMU, Thumb, Thumb 2, and Neon vector instructions. Some exception conditions aren't implemented, and some are implemented differently from hardware (e.g., bkpt).
ARM Architecture Reference Manual, ARMv7-A and ARMv7-R edition
MIPS32 release 5: Models a MIPS32 release 5 CPU, without MMU. Includes a 64-bit double-precision FPU. Traps, exceptions, interrupts, and syscalls are implemented. There is also a simulation model of a hypothetical variant of the architecture where all branch delay slots are disabled, because introductory courses often teach MIPS without the delay slots. When delay slots are disabled, the return address of branch-and-link instructions behave differently (pointing to the instruction after the branch rather than after the delay slot), and exceptions can no longer occur in a delay slot.
MIPS32 release 5 is generally backwards-compatible with older MIPS instruction sets, so the MIPS32r5 model is the right one to use unless you know you are using release 6.
li $t0, 0x04000000   # Bit 26
mfc0 $t1, $12, 0     # Read CP0.status (Coprocessor 0, register 12, select 0)
or $t1, $t1, $t0     # Set bit 26
mtc0 $t1, $12, 0     # Write back to CP0.status
The simulated FPU ignores rounding modes and does not support floating-point exceptions.
MIPS32 release 6: Models a MIPS32 release 6 CPU, without MMU. Includes a 64-bit double-precision FPU. Traps, exceptions, interrupts, and syscalls are implemented. There is also a simulation model of a hypothetical variant of the architecture where all branch delay slots (and forbidden slots) are disabled, because introductory courses often teach MIPS without the delay slots. When delay slots are disabled, the return address of branch-and-link instructions behave differently (pointing to the instruction after the branch rather than after the delay slot), and exceptions can no longer occur in a delay slot.
MIPS32 release 6 makes major changes to the instruction set and is not backwards-compatible with any earlier MIPS instruction set. There are a significant number of new instructions, re-encoded instructions, and removed instructions (e.g., addi has been removed and replaced with addiu). If you're not specifically using release 6, the MIP32 release 5 model is probably the right one to use.
RISC-V RV32: This is a 32-bit RISC-V CPU. Unaligned load/store is supported (but a warning is enabled by default). Only Machine mode is supported (no MMU/paging), including support for machine-level interrupts without an external interrupt controller. The MTI (machine timer) and MSI (machine software interrupt) standard interrupts are supported. Other I/O devices are attached to the platform-defined IRQs 16 to 31.
A floating-point unit is modelled, but rounding modes and exceptions are ignored (including the accural of exception flags in fcsr.fflags). The only rounding mode is round-to-nearest ties-to-even (the only rounding mode supported by WebAssembly), and RISC-V instructions using other rounding modes will silently use the default mode. NaN handling may also differ from the RISC-V specification. For example, signalling NaNs are ignored because exceptions are not supported, and perhaps other cases where WebAssembly defines operations with NaNs differently than RISC-V.
The instruction set modelled is RV32IMAFDZicsrZicbom:
The computer system you choose to simulate determines its CPU and the I/O devices it contains.
This is a Nios II CPU with 4 GB of memory and no other I/O devices.
This is a Nios II system with most of the FPGA-side I/O devices found in the DE1-SoC Computer, the 1 GB DDR3 memory attached to the HPS (Hard Processor System), but no other HPS-attached devices.
There are a few minor differences:
This is a Nios II system with I/O devices based on the DE2-115 Media Computer.
There are a few minor differences:
This is a Nios II system with I/O devices based on the DE2 Media Computer.
There are a few minor differences:
This is a Nios II system with I/O devices based on the DE0 Media Computer.
There are a few minor differences:
This is a Nios II system with I/O devices based on the DE10-Lite Computer.
There are a few minor differences:
This is a ARMv7 CPU with 4 GB of memory and no other I/O devices.
This is a ARMv7 system with most of the FPGA-side I/O devices found in the DE1-SoC Computer, the 1 GB DDR3 memory, Cortex-A9 private timer, and ARM GIC interrupt controller. Many of the complex HPS devices (Ethernet, USB, SDHC, etc.) are omitted.
There are a few minor differences:
This is a MIPS32 release 6 CPU with 4 GB of memory and no other I/O devices. There are two versions of this system: One that follows the MIPS32r6 specification, and one where all delay slots and forbidden slots are disabled.
This is a MIPS32 release 6 CPU with 4 GB of memory, some SPIM- and MARS-compatible system call services, and a SPIM-compatible terminal I/O device. There are two versions of this system: One that follows the MIPS32r6 specification, and one where all delay slots and forbidden slots are disabled.
This is a MIPS32 release 5 CPU with 4 GB of memory and no other I/O devices. There are two versions of this system: One that follows the MIPS32r5 specification, and one where all delay slots and forbidden slots are disabled.
This is a MIPS32 release 5 CPU with 4 GB of memory, some SPIM- and MARS-compatible system call services, and a SPIM-compatible terminal I/O device. There are two versions of this system: One that follows the MIPS32r5 specification, and one where all delay slots and forbidden slots are disabled.
This MIPS system is designed to be similar to the system simulated by the SPIM and MARS simulators, but it is not an exact drop-in replacement due to slightly different assembler syntax. CPUlator uses the GNU assembler, while SPIM and MARS use their own assemblers.
Like other MIPS systems, the general exception handler is usually located at address 0x80000180 (configurable via Coprocessor 0 registers). The SPIM and MARS assemblers use a .ktext directive to place code into the .ktext segment, which usually contains the exception handler. The GNU assembler does not use .ktext or .kdata directives. Instead, CPUlator uses a custom linker script to specify that the contents of the .ktext section should be loaded at 0x80000000 (and .kdata loaded right after .ktext). Thus, instead of a .ktext directive, use .section .ktext, "ax" ("ax" means allocatable and executable) and .org 0x180 to place the exception handler at offset 0x180 of the .ktext section.
This is a RV32 CPU with 4 GB of memory, and the machine-level software interrupt device (MSWI) device mapped to 0xff202110.
This is the generic RV32 system plus SPIM-compatible system calls and terminal device.
This is a RV32 (Nios V/g) system with most of the I/O devices found in the DE1-SoC Computer, the 1 GB DDR3 memory attached to the HPS (Hard Processor System), but no other HPS-attached devices. The machine-level software interrupt device (MSWI) device is memory-mapped to 0xff202110.
There are some differences between the Nios V and the generic RV32 simulated CPUs:
The SPIM and MARS MIPS simulators provide system call services to allow programs to interact with the outside world (mainly the terminal). For compatibility with courses that rely on the system calls provided by these simulators, CPUlator also implements a subset of these services on some of the simulated systems. On systems with SPIM system calls, the system call instructions are handled internally by the simulator. On systems without SPIM system calls, the system call instructions behave as they would in hardware (jump to an exception handler).
The system call instruction and registers to specify the system call number and parameters depend on architecture:
The following system calls are implemented:
| Syscall number MIPS: $v0 RISC-V: a7 | Service | Input arguments | Output arguments | ||
|---|---|---|---|---|---|
| MIPS | RISC-V | MIPS | RISC-V | ||
| 1 | Print integer | $a0 (integer) | a0 | ||
| 2 | Print single-precision float | $f12 (single) | fa0.f | ||
| 3 | Print double-precision float | $f12 (double) | fa0.d | ||
| 4 | Print string | $a0 (pointer to null-terminated string) | a0 | ||
| 5 | Read integer | $v0 (integer) | a0 | ||
| 6 | Read single-precision float | $f0 (single) | fa0.f | ||
| 7 | Read double-precision float | $f0 (double) | fa0.d | ||
| 8 | Read string | $a0 (char*, pointer to start of output buffer) $a1 (unsigned int, maximum chars to read) | a0 a1 | ||
| 9 | Allocate memory (sbrk) | $a0 (unsigned int, bytes to allocate) | a0 | $v0 (pointer to allocated memory) | a0 |
| 10 | Exit | ||||
| 11 | Print character | $a0 (char) | a0 | ||
| 12 | Read character | $v0 (char) | a0 | ||
| 17 | Exit2 | $a0 (integer, result code) | a0 | ||
| 30 | Time (milliseconds since Jan. 1, 1970) | $a0 (lower 32 bits) $a1 (upper 32 bits) | a0 a1 | ||
| 32 | Sleep | $a0 (unsigned int, milliseconds) | a0 | ||
| 34 | Print integer (hex) | $a0 (integer) | a0 | ||
| 35 | Print integer (binary) | $a0 (integer) | a0 | ||
| 36 | Print integer (unsigned) | $a0 (integer) | a0 | ||
The SPIM terminal I/O device is memory-mapped to a 16-byte region at address 0xffff0000, using hardware IRQ 0 on MIPS, and 24 on RISC-V.
The SPIM system calls that interact with the terminal are implemented by doing loads and stores to access the terminal device,
so it is possible to use both memory-mapped I/O and system call services to interact with the terminal, as long as you are aware how the two methods will interact with each other.
See the section on the SPIM Terminal device for more details.
For the ARMv7 architecture, there is a minimal implementation of some Semihosting calls to allow basic functionality for C programs compiled to use Semihosting for its I/O. See the ARM Semihosting documentation for a detailed description of Semihosting services.
In general, Semihosting calls use svc 0x123456 (supervisor call instruction with call number 0x123456), with the operation type specified by r0, and any input operands passed in memory pointed to by r1. The result of the operation is returned in r0.
The following Semihosting calls have at least minimal support:
| Operation number r0 | Service | Input arguments | Return value r0 | Notes |
|---|---|---|---|---|
| 0x1 | SYS_OPEN | 1 | Intended to open a file with a given file name. Since files aren't supported, CPUlator blindly assumes you're trying to get a file handle to the console (filename ":tt"). Does nothing and returns 1. | |
| 0x2 | SYS_CLOSE | 0 | Does nothing and returns 0 (success) | |
| 0x5 | SYS_WRITE | [0]: File handle [4]: Pointer to data [8]: Data length | 0 | Assumes you're writing to the console (file handle is ignored). Writes data to the Messages window |
| 0x9 | SYS_ISTTY | 1 | Returns 1 (File is a TTY (console)) | |
| 0xc | SYS_FLEN | 0 | Returns 0 (File length is zero) | |
| 0x10 | SYS_CLOCK | time | Returns centiseconds past arbitrary point in time. | |
| 0x11 | SYS_TIME | time | Returns seconds since Jan. 1, 1970. | |
| 0x15 | SYS_GET_CMDLINE | 0 | Intended to retrieve argc and argv. Does nothing and returns 0 (success) | |
| 0x16 | SYS_HEAPINFO | Pointer to output struct | Writes zeros to the output data block (claiming we can't compute the heap/stack base and limit). | |
| 0x18 | angel_SWIreason_ReportException | Reason | 0 | If reason (r1) is 0x20026 (ADP_Stopped_ApplicationExit), stop the simulation. |
All of the simulated I/O devices generally behave the same as the I/O devices in the Altera University Program's DE1-SoC Computer system. This section describes some of the differences and the user-interface features in the simulator.
All of the I/O device panels have a drop-down menu ()at the upper-left corner of the panel. This menu is used to configure options (e.g., how many switches to show) or for debugging (e.g., forcing a timer to time out). The contents of this menu depends on the device. Some devices also have documentation () that is shown when the mouse cursor is hovered.
The drop-down menu contains an option to show more switches, buttons, etc. than what is available on the real hardware board. Push buttons are displayed as checkboxes in the web browser. While this means two clicks are required to press and release a button, it allows you to simulate simultaneously pressing multiple buttons.
For general-purpose GPIO ports, CPUlator can't simulate the external device attached to it because it doesn't know what that device is. Thus, it just shows checkboxes so you can observe and set the logic state at each of the GPIO pins manually.
The state of each bit is shown as a check box. The check box state tells you the pin's value (0 or 1), its direction (input or output), and whether the pin is requesting an interrupt (mask and edge capture both 1).
Input pin (shown as enabled)
Output pin (shown as disabled)
Requesting interrupt (green background)
Timers include the Interval Timer, Cortex-A9 private timer, Cyclone V hard processor system watchdog timer, and RISC-V Machine-level timer. In the simulator, the internal state of the timer (counter, one-shot or continuous mode, etc.) are shown. There is also a Force Timeout Now function in the drop-down menu that causes the counter to jump to 1 and trigger a timeout (if the timer is running). This is useful when debugging with long timeouts.
The JTAG UART device is attached to a terminal in the Altera Monitor Program, so it is also attached to a terminal in the simulator here. Bytes sent from the CPU to the UART will be shown. To send bytes to the UART, first click on the terminal inside the UART device's panel to give it keyboard focus, then type. The simulated device also shows the state of the read and write FIFOs.
The terminal supports VT100 escape codes, like the one in the Altera Monitor Program, though with some minor differences in behaviour.
The simulator interface provides several methods of sending input to emulate what a PS/2 keyboard or mouse would send. Choose the method (Keyboard, Mouse, or Custom) by selecting the option in the PS/2 device's drop-down menu. The simulator generally does not accurately model the power-on negotiation sequence by keyboards or mice, but does have some basic support for responding to a few commands (such as reset).
The following commands are recognized:
This models the VGA device from the Altera University Program computer systems.
The details of the VGA DMA device (including page flipping) are accurately modelled. Thus, in addition to being able to draw pixels by writing to the pixel buffer, the pixel buffer location can be changed to another region of memory, and page flipping can also be simulated. The pixel buffer is initialized to random values to discourage using the display without first clearing it, but in the DE1-SoC the pixel buffer is initialized to black (This wasn't the case with the older DE2 that used an off-FPGA frame buffer SRAM).
In hardware, the character buffer is an overlay on top of the pixel buffer. This behaviour is accurately modelled.
The character buffer DMA controller was changed starting with University Program 16.0 to use the same DMA controller as the pixel buffer. This enabled support for page flipping, removed character buffer clearing hardware, and made some other incompatible changes to the registers. CPUlator only simulates the new v16.0 character buffer DMA controller.
The simulated audio device supports output and input. Audio playback goes to your web browser's audio output. Audio recording is functional, but will record a sawtooth wave with period 32 samples (250 Hz at 8 kHz sampling rate, 1500 Hz at 48 kHz sampling rate) rather than from a microphone. This device models the audio device from the Altera University Program computer systems
Due to the non-realtime nature of a web browser, the simulated audio interface has much larger audio sample buffers to absorb jitter. The buffer sizes shown in the display are the larger buffers, not the 128-entry FIFO visible to the program. Despite this change, there is no change to the register-level interface (the bigger buffers are hidden except for timing differences). In the simulator, audio input FIFO underflows and output FIFO overflows are tracked to make sure your code isn't underflowing or overflowing the buffers. In hardware, this is harder to detect, as the only symptoms are noisy sound or sound that appears to play at an inappropriate speed. Use Reset overflow to reset the overflowed/underflowed state.
The Altera University Program computer systems changed the audio device's sampling rate from 48 kHz to 8 kHz starting in version 17.0. Because this change is not backward compatible, CPUlator's audio device's sampling rate is parameterizable (by adding &d_audio=48000 to the query string), so that both new and old systems can be simulated.
Differences from real hardware:
This simulator in a web browse can't use a real TV signal as input. However, the video input device and its DMA controller are correctly modelled. Instead of a user-provided video, it paints a test image (that moves) to its output buffer (defaults to the VGA pixel buffer location). This allows you to test enabling the video input device and relocation of the output buffer location.
The ADC device on the DE1-SoC is modelled, but just returns a different number for every read instead of a real signal. The ADC interface is based on version 16.0+ of the DE1-SoC Computer, which includes a valid bit at bit[16] of each channel. The interface in version 15.1 and earlier omitted the use of the valid bit.
The Lego controller is a custom device used at the University of Toronto and is not part of the standard DE1-SoC Computer.
The basic functionality of the Lego Controller is simulated here, allowing you to interact with the Controller from your program, manually specify sensor readings, and observe motor on/off/PWM state.
This is a custom device used at the University of Toronto and is not part of the standard DE1-SoC Computer. The rest of this description assumes you know the lab assignment that this device is used with. While this device does not let you control the Carworld game (as there is no way to connect to the game), it will show you whether you are able to send and receive commands correctly to/from the game. See the Help popup on the device for more details.
This is a memory-mapped I/O device that is largely compatible with the terminal device used in the SPIM and MARS simulators. The I/O device uses memory-mapped I/O and one interrupt line that signals both read and write interrupts (This differs from SPIM, which uses two IRQ lines).
For compatibility with SPIM and MARS, the terminal devices is usually placed at address 0xffff0000. It can also be accessed by several system calls. In CPUlator, these system calls are implemented by performing memory-mapped I/O (loads and stores). Thus, you can use both methods to access the terminal device, as long as you are aware of how the system calls can change the I/O device's state.
The terminal device has four memory-mapped registers (with the same functionality as in SPIM)
| Receiver control ffff0000 |
| ||||||
|---|---|---|---|---|---|---|---|
| Receiver data ffff0004 |
| ||||||
| Transmitter control ffff0008 |
| ||||||
| Transmitter data ffff000c |
|
The receiver control ready bit (ffff0000 bit 0) indicates that at least one byte is available for reading by your program (There is a 64-byte receive queue). The received data byte is retrieved by reading the receiver data register (ffff0004). Each read will remove one byte from the receive queue. If the receiver interrupt enable bit is 1, then the terminal I/O device will request an interrupt whenever it is ready (on IRQ line HW0, corresponding to IP2).
The transmitter control ready bit (ffff0008 bit 0) indicates that it is ready to accept at least one byte for transmission (There is a 64-byte transmit queue). To send a character, the byte should be written to the transmitter data register (ffff000c). Each write will enqueue one byte onto the transmit queue, which will eventually (typically within 50ms) be shown on the terminal. If the transmitter interrupt enable bit is 1, then the terminal I/O device will request an interrupt whenever it is ready to accept a byte for transmission. Unlike SPIM, the receive and transmit interrupts use the same interrupt line, HW0, corresponding to IP2. If you use both receive and transmit interrupts, the ready bits need to be checked to determine which request(s) to service.
The terminal does not echo typed characters back to the display. However, the system call routines to read from the terminal will echo any typed characters, but only when the system call is running.
The Machine-level software interrupt device is implemented, as specified in the RISC-V Advanced Core Local Interruptor Specification. Because there is only one simulated core, there is only one memory-mapped MSIP register mapped to address 0xff202110. Writing a 1 in the least significant bit of the MSIP0 register causes interrupt 3 to be requested.
Due to the COVID-19 pandemic of 2020, many in-person labs were changed to be done online. There has been a need to find online substitutes for lab exercises that were cancelled. These devices are an attempt to increase the variety of lab exercies that can be simulated, and are not part of the original computer systems.
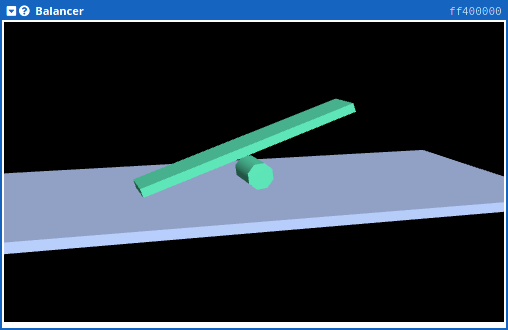
This device is a simulation of the balancing device exercise used at the University of Toronto. The original lab exercise used a program to control a physical object. Here, the physical object is replaced with a physics simulation, and the program running in the simulator interacts with the simulated physical world.
The beam balancer is similar to a simplified inverted pendulum. There is a beam on top of a motorized wheel in the center. Because the center of mass is higher than the wheel (pivot point), the beam tips over unless the motor is used to actively balance the beam. The distance from each end of the beam to the ground can be observed (beam is balanced if the two distances are equal), and the wheel can be driven left or right with a motor. The objective is to observe the tilt of the beam and drive left or right to keep the beam balanced.
The user can interact with the balancer by applying a torque on the beam to tip it to the left or right. Pressing the left mouse button inside the graphical output rectangle applies a torque to the balancer. The horizontal position of the mouse cursor controls the strength of the torque: The left edge is a strong counter-clockwise torque (balancer tips left), the middle applies no torque, and the right edge is a strong clockwise torque. This feature can be used to test how well a control algorithm responds to external forces on the balancer.
The beam balancer uses two 32-bit memory-mapped registers to interact with the computer system. These are used to allow a program to set the motor direction and strength, and receive information on whether the beam is balanced, and where it is located on the ground.
| Beam tilt and motor control ff400000 |
| ||||||
|---|---|---|---|---|---|---|---|
| Position ff400004 |
|
Left and right distance: Read only. These are 8-bit unsigned integers (0 to 255) that report the distance between the left and right edges of the beam to the ground (larger number is further). The beam is balanced when these two numbers are the same.
Motor control: Read/write. This is a 16-bit signed integer (-32767 to +32767), used to control motor power. Setting this to 0 stops the motor, a positive number drives to the right, and a negative number drives to the left. A number with a higher magnitude drives the motor with more torque and speed.
Position: Read only. This is a 32-bit signed integer indicating the horizontal position of the center of the beam. This is used only if you want to know the location of the balancer to move it to a particular location along the ground. The center of the ground is 0, while the left and right ends are approximately ±40000.
| January 2016 | First release, supporting Nios II |
| October 2016 | Added ARMv7 |
| September 15, 2017 | Simulator is named CPUlator |
| January 7, 2018 | User interface rewritten |
| January 26, 2018 | Added MIPS32r6 |
| November 23, 2018 | Added MIPS32r5 |
| February 1, 2019 | Updated DE10-Lite VGA pixel buffer device (v.733) |
| March 23, 2020 | Add ARM GIC debugging output (v.784) |
| October 18, 2020 | Add beam balancer device (v. 802) |
| December 24, 2023 | Switched from asm.js to WebAssembly (v. 814) |
| March 7, 2024 | Add RISC-V RV32 (v. 831) |
CPUlator is a functional simulator of a processor and I/O devices. A functional simulator models the functionality of instructions without modelling the amount of time (or number of cycles) each instruction would take to execute. The CPUlator simulator (like a real processor) runs machine code only (i.e., instruction bytes in memory), and does not understand assembly language source code. An assembler is used to compile source code into machine code (an ELF executable) before simulation occurs.
The rest of this section will provide an overview of how the various parts of the simulator function, as well as how the simulator is implemented as a web application.
The core of the simulator (and of a real computer) is the processor. The CPUlator CPU is fairly straightforward. The processor repeatedly fetches an instruction from the current pc, decodes the instruction (a few big switch statements), then performs the required action (e.g., a computation that modifies a destination register). Each instruction is processed to completion before the next instruction is fetched from memory. Thus, CPUlator is a functional simulator, and does not model pipelining or execution time.
Branch delay slots, used by MIPS processors, are implemented by storing the branch target address computed by a branch instruction, then applying the update of pc after the next instruction is complete. This also offers the opportunity to verify that the next instruction was not a branch or other forbidden instruction.
The CPUlator processor models are written in C++, and isn't derived from other simulators.
The processor performs memory accesses (both instruction fetch and data load/store), by sending a request with an address. The memory system services these requests by determining which device should handle the request (based on address), then performs the memory access on the target device. The memory system is also responsible for detecting if a particular address does not map to any device, in order to generate a warning.
Internally, there is no distinction made between memory and memory-mapped I/O devices. Every I/O device has an address range it services, and memory is just one particular type of device.
A processar and memory system is a complete computer system, but it still needs a method to load a program into the computer's memory. This is the function of the program loader. CPUlator implements an ELF executable loader. The ELF loader parses the contents of an ELF file and makes use of several parts of the executable:
There are many diferent I/O devices that are simulated. Each one is implemented as a C++ class. I/O devices respond to memory accesses that target the memory region assigned to the device.
The memory device is particularly interesting. In many of the simulated computer systems (especially the "generic" ones), there is a large amount of simulated memory (up to 4 GB). However, it is impossible to allocate that much memory in a web browser. Fortunately, most programs only ever use a small amount of memory, even in a system with 4 GB of memory. Thus, the memory device internally implements paging (one-level page table), to provide the illusion of a large amount of memory, but only allocating pages once they are modified. As pages are modified, more (web browser) memory is allocated to hold the simulated memory contents, and the simulator can eventually run out of (web browser) memory and crash. This can happen when simulating a buggy program where a non-terminating loop continually writes to increasing addresses in memory.
A processor, memory, I/O devices, and a program loader allow the simulator to run programs. Now we need debugging features to control program execution and observe the state of the system. The debugging functionality is implemented by controlling the simulator and querying the simulated computer system state. This means that instruction set features intended to support debugging (typically a debug interrupt or debugging processor mode) are not necessary and not implemented, and any breakpoint instructions are implemented by stopping the simulator, rather than taking an exception into a debugging mode.
The rest of this section discusses how some of the debugging features are implemented in the CPUlator debugger.
The disassembler is similar to the CPU simulation model, but returns a textual representation of each instruction instead of executing it. It disassembles bytes in memory, regardless of whether those bytes are code, data, or even self-modifying code.
It can often useful to show both disassembly and the source code lines that correspond to the machine instructions. Doing so requires debugging information to map source code to/from machine instructions, and access to the source code itself. The CPUlator debugger extracts line number information from an ELF executable whenever it is loaded. CPUlator currently only understands DWARF format. DWARF format line number information is located in the .debug_line section of an ELF executable. This information provides a mapping between machine instructions and a source code file name and line number that corresponds to the instruction.
The debugging information in ELF executables does not contain the source code itself. For programs compiled using the built-in assembler, CPUlator keeps a copy of the source code in memory when a program is compiled and loaded. The debugger then uses line number information to look up the corresponding lines of source code and displays it in the disassembly window. When simulating ELF executables, the debugger has no access to the source code, so the best it can do is display file name and line number information.
The current algorithm assumes that the .debug_line section of an ELF executable contains a concatenation of line number programs (one per compile unit), with no padding bytes in between. This assumption has held true so far, but, as far as I can tell, isn't guaranteed. The correct (but more complex) method is to first parse the .debug_info section to look for compile units, and then use the DW_AT_stmt_list attribute of each compile unit (which is a pointer into the .debug_line section) to locate each line number program.
The debugger attempts to track function calls and returns to generate a call stack. This is done by instrumenting all of a processor's function call and return instructions, (similar to how a return address stack predictor would work). This method isn't perfectly reliable, as it relies on a program using commonly-used idiomatic code sequences to do function calls and returns. In most programs (especially simple programs), this assumption is valid unless you are specifically trying to write code to defeat the call/return tracking mechanism. Tracking calls and returns at run-time as they happen does not depend on the use of a frame pointer or well-formed stack frames. The same mechanism is applied to interrupts and exceptions, including nested exceptions.
The call (and interrupt) stack also includes a snapshot of processor registers. This saved register state is used to verify that functions are returning to the expected location, and that callee-saved registers still have the same value at the end of a function as it did at the beginning.
In a simulator environment (unlike on a real processor), implementing single-stepping of machine instructions is trivial: Just run the simulation for one instruction cycle.
Stepping over a function call and stepping out of a function is not as easy. In CPUlator's debugger, the call stack tracking mechanism is used to also implement step-over and step-out. Tracking calls and returns allows the debugger to know the depth of the call stack at every moment in time. Step-over means running the processor until the next instruction at the same call stack level. Step-out means running the processor until the next instruction at a call stack depth one less than the current level. This method even works for recursive function calls, but fails if the program performs a call or return using a non-standard code sequence that isn't recognized as a call or return.
The CPUlator debugger checks for two behaviours at instruction fetch that are highly indicative of a bug: A processor that is executing data bytes, and self-modifying code. While these behaviours are not necessarily incorrect, it is almost certainly a bug if they occur unintentionally. Both of these checks use information from the most-recently-loaded ELF executable.
A processor is considered to be executing in a code region if the instruction fetch address (pc) is within the address range of an ELF section marked allocatable and executable (e.g., the .text section). If the processor is executing within a different type of section (e.g., .data is typically not marked as executable), or is executing instruction bytes that did not come from the ELF executable at all, a warning is thrown because it is likely a bug.
Self-modifying code is checked by comparing the instruction fetched from memory with the data in the original ELF executable and ensuring they are the same. This method detects self-modifying code when the modified code is subsequently executed, not at the point when it is modified (Use a watchpoint to detect a modification). It is not practical to detect self-modifying code at the moment of modification because there is no method to know whether any byte in memory is code or data. Although unconventional, having read-write data in the .text section commonly occurs, so detecting writes to the .text section would have too many false positives.
CPUlator includes a web interface to the GNU assembler (gas) running on the server. The assembler is the standard binutils package compiled for each supported target instruction set, with no custom modifications. The "Compile and Load" button sends the contents of the Editor window to the server, which runs the assembler in a temporary directory and replies with the assembler's output messages and an ELF executable (if compiling succeeded). The assembler is the only part of CPUlator that runs on the server.
The built-in interface to the GNU assembler exists solely for convenience. Any compiler or assembler that generates statically-linked ELF executables can be used with the CPUlator simulator.
CPUlator is a web application. Except for the assembler, everything runs client-side in a web browser. The code is divided into two parts (both of which run in the web browser):
The simulator core is delivered to the browser as WebAssembly code, and the user interface is the usual HTML, CSS, and JavaScript.
When run in a web browser, the simulator uses two threads. The simulator core and a minority of the user interface-related code run inside a web worker thread, while most of the user interface runs in the main JavaScript thread. This allows the user interface to stay responsive even while the simulator is busy simulating, at the expense of code complexity. Web worker threads are completely isolated from the main thread and the HTML page, except for message passing between the two threads.
The simulator core is written in C++, then compiled into WebAssembly using Emscripten (Compiled to asm.js before December 2023). WebAssembly treats the compiled code as a well-isolated "module" that shares nothing with the rest of the JavaScript runtime state except for the ability to call functions from one side to the other. Thus, CPUlator's core is structured similarly. It is isolated from the user interface JavaScript code, and communicates through a fairly small set of functions (about 35).
The simulator core is written in C++ both for speed (WebAssembly is faster than idiomatic JavaScript) and because it is easier to write low-level bit manipulation code in C++ than JavaScript.
The user interface is written in JavaScript. It communicates with the simulator core (WebAssembly) and manipulates HTML DOM elements. Many of the user interface elements make use of existing JavaScript libraries, for which I am grateful.
Code size: As of Januar 2024, the project (excluding third-party libraries) contains approximately 16000 lines of C++, 10000 lines of JavaScript, and 1200 lines of CSS.