CPUlator is a debugger and simulator of a Nios II or ARMv7 computer system and I/O devices. Simulation allows running and debugging programs without needing to use a hardware board. When you load an assembly program or ELF executable on the simulator, the program will behave (almost) identically to the same program running on real hardware. The simulated systems are based on the computer systems from the Altera University Program.
The primary advantage of using a simulator is the ability to do lab assignments without needing access to the hardware board. Another advantage is that simulators have greater visibility into the system state, and can warn about incorrect or suspicious behaviours, such as self-modifying code or violating calling conventions. There are some limitations to software simulation: A simulator cannot interact with physical hardware devices, and is somewhat slower than hardware (by about 2–20 times).
There are four main components in a typical development flow for simple assembly programs: Source code written by the user, an assembler (or compiler for a higher-level language) to transform the source code into executable machine code, a computer system to run the machine code, and a debugger to observe the behaviour of the program running on the computer. CPUlator provides the assembler, computer, and debugger inside a web browser (sorry, we don't write your code for you).
In the Altera Monitor Program development flow, the Monitor Program provides the assembler and debugger, while the computer system is running on an FPGA development board attached to the host PC over a programming cable. (Top-most option in the figure below)
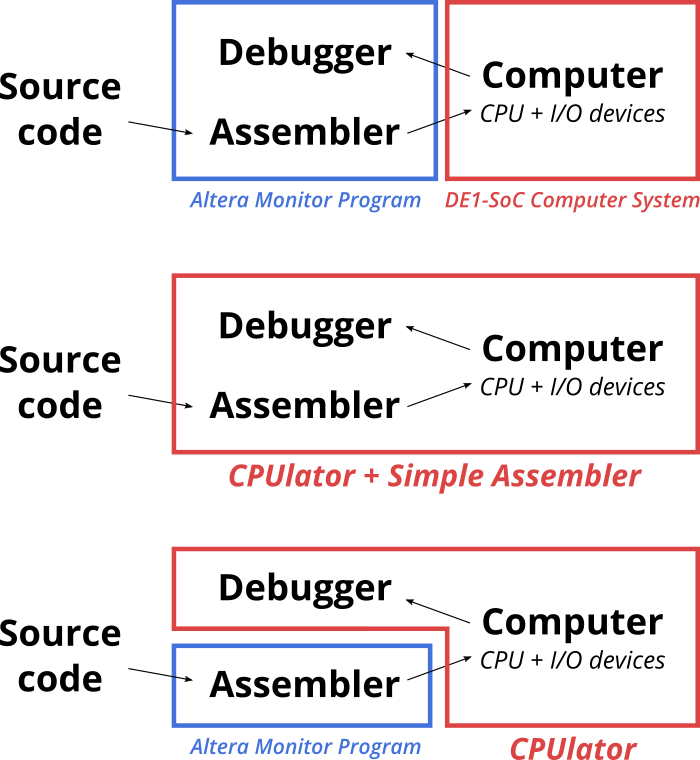
CPUlator replaces both the computer system and debugger, and optionally also the assembler. For simple programs (one source file), using the built-in assembler (GNU assembler) is the most convenient option (Above figure, middle option). For more complex programs, it is also possible to assemble or compile your project into an ELF executable using any tools you wish (e.g., Altera Monitor Program) and then simulate the executable (above figure, bottom-most option).
The built-in assembler is an interface to the GNU assembler. When Compile and Load is clicked, the contents of the Simple Assembler editor is uploaded to the server, saved as a single file, then run through the GNU assembler. The server then sends back the ELF executable and any assembler output messages, and the executable is loaded into the simulator.
Because the ELF file is generated at the server, there are limits on the size of the compiled executable (currently 12 MB). If your program is bigger than a megabyte or so (which sometimes happens if it includes images or audio as initialized data), it is usually faster to compile your program locally than to download megabytes at every compile. If your program is substantially bigger than this, be aware that the executable size causes the simulator itself to consume memory to hold the executable. Don't expect the simulator to ever work with gigabyte-sized executables.
For ARMv7: The GNU assembler uses "divided" syntax by default. If you're writing in the newer "unified" syntax, use a .syntax unified directive to change the syntax. The differences are minor, so this won't affect most programs. The CPUlator disassembler uses instruction names in unified syntax (this only affects a few infrequently-used instructions).
The Altera Monitor Program can be used to compile projects without being connected to an FPGA board. However, actions that interact with the board need to be avoided.
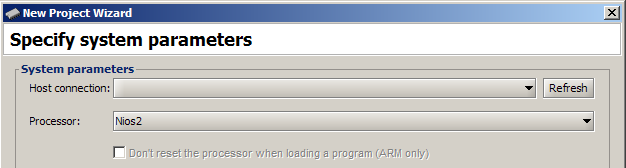
When creating a project, specify the "DE1-SoC Computer" system as usual. This is important because the compiler makes certain assumptions (e.g., system memory size) that depend on the computer system, and should match what's being simulated here.
When prompted to select the programming cable, it's ok to leave it blank, as we
won't be using it.
When prompted, do not download the computer system to the board. Choose No. 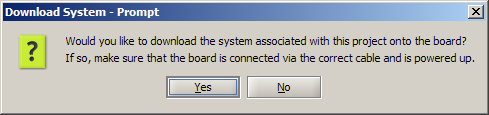
You can now compile your project as usual, but do not use "Load" nor "Compile & Load".
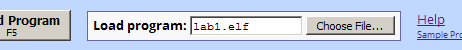
Compiling the program produces a filename.elf (or filename.axf for ARM) executable file in your project directory. To load the executable
into the CPUlator simulator, use Load program and choose this executable file.
The toolbar along the top has the usual debugging operations: step, step over, continue, stop, restart, and reload. These are mapped to the same shortcut keys as in the Altera Monitor Program.
Step over and step are the same except when single-stepping a call instruction. Step will single-step into
the first instruction of the function, while Step over will skip over the function entirely, stopping at the instruction following the call.
This can be useful for skipping over big assumed-bug-free functions such as printf. Step over is implemented by tracking function calls
and returns (the same mechanism used to show the call stack). If your function calls and returns are not properly paired or you use an unusual call or return
method that is not recognized as a call or return, you may get strange behaviour.
The reload function reloads the executable into memory. If you are simulating an ELF executable from disk, the executable is reloaded from disk, in case the executable on disk has changed due to being recompiled. If you are compiling using the Altera Monitor Program, compiling (Ctrl-Shift-C in the Monitor Program) then reloading (F5 or click "Reload Program" in the browser) will load the new program.
This shows the disassembly of a memory region. This shows only a disassembly of the instructions in memory, not lines from your source code.
Immediately above the disassembly window, there is a "Go to address, label, or register"
text input. This allows you to jump to a particular location in your program.
The box will accept hexadecimal numbers (3a8), labels (_start), or
registers (pc).
You can force the program to move to a different instruction by changing pc.
This can be done by changing pc in the registers window, or
double-clicking the target line in the disassembly (This works the same way in the Monitor Program).
This shows a region of memory as an array of 32-bit words. The number format and number of words per row is configurable in the Settings window.. You may edit values in memory by clicking a word to pop up a text box, entering a new hexadecimal value, then pressing Enter. Pressing ESC will cancel the edit. Above the Memory Window, the "Go to..." box works in the same way as for the Disassembly window.
When viewing the memory address ranges of memory-mapped I/O devices, the simulator will show you the values at those memory locations as if a load were performed, but without triggering any of the side effects that would normally be performed in response to a load (such as dequeueing a FIFO). This may make it slightly easier to observe the system state without disturbing it. (However, there is currently no method to intentionally trigger the side effects from the debugger.) This behaviour differs from using a debugger with real hardware.
The devices window allows you to interact with the hardware devices in the computer system outside the CPU, such as LEDs and switches. Because we're limited to operating in a web browser, the interface sometimes differs from the board. For more complicated I/O devices, sometimes this interface is simplified, without full functionality, but still giving you a way to test how your program interacts with the device. In some cases, the interface also shows extra debugging information about the state of the I/O device, to help in debugging your program.
The panels in the Devices window can be reordered by dragged them around, so you can group commonly-used devices together for convenience.
A watchpoint is used to pause the simulation (like a breakpoint) whenever a certain region in memory is read or written. There are four data watchpoints to allow monitoring four memory regions for loads and stores (but not instruction fetches).
Each memory region has a start and end address (in hexadecimal). The R and W checkboxes select whether the simulation should stop when a memory read or write occurs. Regardless of whether these checkboxes are enabled, the number of reads and writes into the memory region and the most recent instruction that accessed the region are recorded. The Reset button resets these counters.
The messages window at the bottom shows various messages that may be generated by the simulator. Click the blue header to hide or show it. It will automatically pop open when a new message is printed.
These messages may be useful for debugging, particularly messages that warn about reading or writing to addresses that appear to be invalid.
The CPUlator simulator does more sanity checks than a real processor, to catch common errors. When it detects something suspicious, the simulator will stop executing (as if a breakpoint occurred), allowing you to examine the cause of the problem as soon as it's detected. Any of these checks can be disabled by unchecking the desired checkbox in Settings → Debugging Checks.
This is a Nios II system with all of the FPGA-side I/O devices found in the DE1-SoC Computer, the 1 GB DDR3 memory attached to the HPS (Hard Processor System), but no other HPS-attached devices.
There are a few minor differences:
This is a Nios II CPU with 4 GB of memory and no other I/O devices.
This is a ARMv7 system with all of the FPGA-side I/O devices found in the DE1-SoC Computer, the 1 GB DDR3 memory, Cortex-A9 private timer, and ARM GIC interrupt controller. Many of the complex HPS devices (Ethernet, USB, SDHC, etc.) are omitted.
There are a few minor differences:
This is a ARMv7 CPU with 4 GB of memory and no other I/O devices.
All of the simulated I/O devices generally behave the same as the I/O devices in the Altera University Program's DE1-SoC Computer system. This section describes some of the differences or user-interface features in the simulator.
Timers include both the Interval Timer and Cortex-A9 private timer. In the simulator, the internal state of the timer (counter, one-shot or continuous mode, etc.) are shown. There is also a Force Timeout Now button that causes the counter to jump to 0 and trigger a timeout. This is useful when debugging with long timeouts.
The JTAG UART device is attached to a terminal in the Altera Monitor Program, so it is also attached to a terminal in the simulator here. Bytes sent from the CPU to the UART will be shown. To send bytes to the UART, click on the terminal inside the UART device's sub-window to give it keyboard focus, then type. The simulated device also shows the state of the two FIFOs.
The terminal supports VT100 escape codes, like the one in the Altera Monitor Program, though with some minor differences in behaviour. The terminal uses code from https://github.com/chjj/term.js.
This device is a custom device used at the University of Toronto and is not part of the DE1-SoC Computer. The rest of this paragraph assumes you know the lab assignment that this device is used with. While this device does not let you control the game (as there is no way to connect to the game), it will show you whether you are able to send and receive commands correctly to/from the game. See the Help popup on the device for more details.
The details of the VGA DMA device (including page flipping) are accurately modelled. Thus, in addition to being able to draw pixels by writing to the pixel buffer, the pixel buffer location can be changed to another region of memory, and page flipping can also be simulated. The pixel buffer is initialized to random values to discourage using the display without first clearing it, but in the DE1-SoC the pixel buffer is initialized to black (This wasn't the case with the DE2 that used an off-FPGA frame buffer SRAM).
In hardware, the character buffer is an overlay on top of the pixel buffer. This behaviour is accurately modelled here.
Due to the non-realtime nature of a web browser, it was necessary for the simulated audio interface to have much larger audio sample buffers to absorb jitter. Despite this change, there is no change to the register-level interface (the bigger buffers are hidden except for timing differences). In the simulator, audio input FIFO underflows and output FIFO overflows are tracked to make sure your code isn't underflowing or overflowing the buffers. In hardware, this is harder to detect, as the only symptoms are noisy sound or sound that appears to play at an inappropriate speed. Use Reset overflow flags to reset the Has overflowed/underflowed state.
The simulator interface provides several methods of sending input to emulate what a PS/2 keyboard or mouse might send. The simulator generally does not accurately model the power-on negotiation sequence by keyboards or mice, but does have some basic support for responding to a few commands (such as reset). See the Help popup for more details.
This simulator can't input a real video as TV input. However, the video input device (and its DMA controller) is correctly modelled. Instead of a user-provided video, it paints a test image (that moves) to its output buffer (defaults to the VGA pixel buffer location). This allows you to test enabling the video input device and relocation of the output buffer location.
The ADC device on the DE1-SoC is modelled, but just returns a different number for every read instead of a real signal. The ADC interface is based on version 16.0+ of the DE1-SoC Computer, which includes a valid bit at bit[16] of each channel. The interface in version 15.1 and earlier omitted the use of the valid bit.